
Day 1 was the peak on every Amazon account we watched during Prime Day 2026. Every single one. And it wasn’t a small peak — Day 1 ran roughly 3× the day-before baseline these brands were doing the week Prime Day opened. Few operators planned for that shape.
Across 170+ managed brands and $29M+ in ad spend, we and most of the industry built our 2026 pacing around the 2025 back-loaded pattern — the one where Days 3–4 outran Day 1 by wide margins. The four-day format inverted it completely. Sellers who bid conservatively on Day 1 hoping for a Day 4 finish watched competitors capture the biggest single conversion window of the event — and the biggest single-day sales multiplier these accounts saw in the run-up to Q3.
What follows is our first-person operator view from inside the accounts we run: the daily data, the pattern that repeated across every size of brand, and what it means for Q3 and Prime Day 2027.
Quick navigation:
- What did Prime Day 2026 look like in the daily data?
- Why did discipline beat category tailwinds?
- What surprised our operators this year?
- What should you do with these early signals?
- What does this mean for Prime Day 2027 planning?
What did Prime Day 2026 look like in the daily data?
Here’s the daily sales across four accounts we sampled, spanning small ($11K/day) to large ($59K/day) brands:
| Account tier | Day 1 | Day 2 | Day 3 | Day 4 | Day 3 (trough) vs Day 1 | Day 4 vs Day 1 |
|---|---|---|---|---|---|---|
| $17K/day | $17,460 | $15,750 | $13,890 | $15,020 | −20.5% | −14.0% |
| $11K/day | $11,280 | $10,190 | $8,760 | $9,940 | −22.3% | −11.9% |
| $26K/day | $25,680 | $23,240 | $20,110 | $22,540 | −21.7% | −12.2% |
| $59K/day | $59,229 | $52,302 | $46,873 | $50,614 | −20.9% | −14.5% |
Look at how tight those last two columns are. Every account we sampled — from a $11K/day brand to a $59K/day brand — bottomed out 20-22% below Day 1 on Day 3, then recovered to 12-15% below Day 1 on Day 4. Not one produced a Day 4 that beat Day 1.
Now zoom out for scale. Compared against what these same brands were doing the day before Prime Day opened, Day 1 ran roughly 3× baseline across the sample — the smaller brands nearly quadrupled their normal daily volume on June 23, and even the largest more than doubled. Every day of Prime Day 2026 was a 2-4× baseline day for these accounts. Day 3 — the low point of the event — was still ~3× normal daily volume. So the “conservative Day 1” pacing wasn’t just saving budget for a Day 4 that never came; it was actively passing on the biggest single-day sales multiplier these brands had seen in the run-up to Q3.
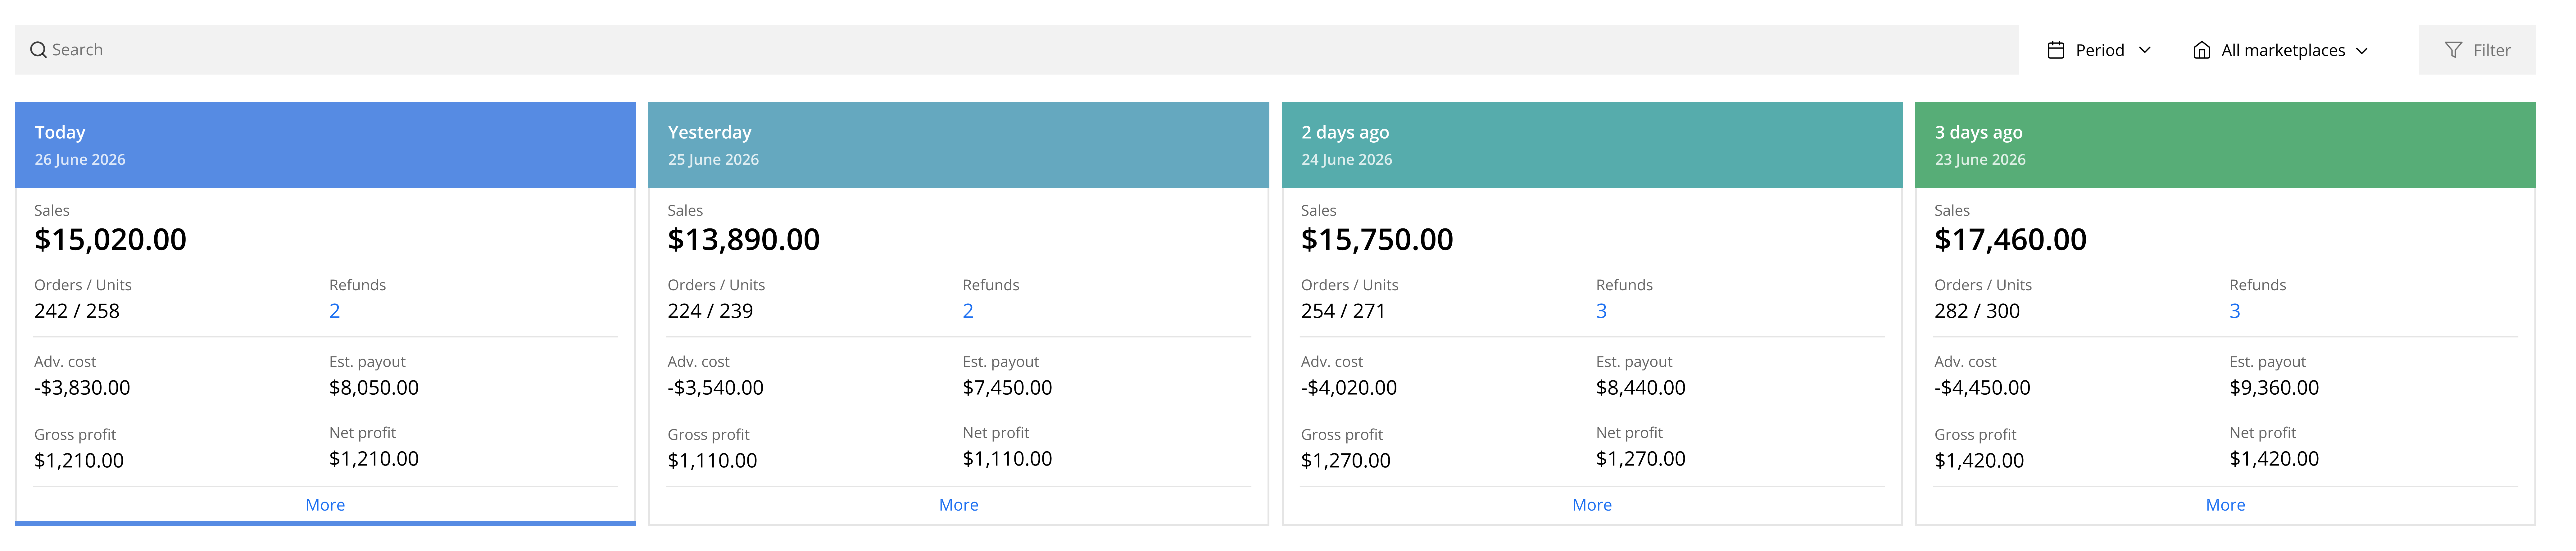
The screenshots below show the raw daily-sales cards from four different accounts. Notice how the shape of the curve is nearly identical on every one — Day 1 peak, Day 3 dip, Day 4 bounce that never gets back to Day 1.
Day 1 peaked. Day 4 came in −14%.
Normal daily sales the day before Prime Day (June 22) were $4,380. Day 1 of Prime Day (June 23) hit $17,460 — nearly 4× baseline. Sales declined through Day 3 to $13,890 (still ~3× baseline), then recovered to $15,020 on Day 4 — never getting back to Day 1.
Swipe / drag left–right to read the full dashboard →
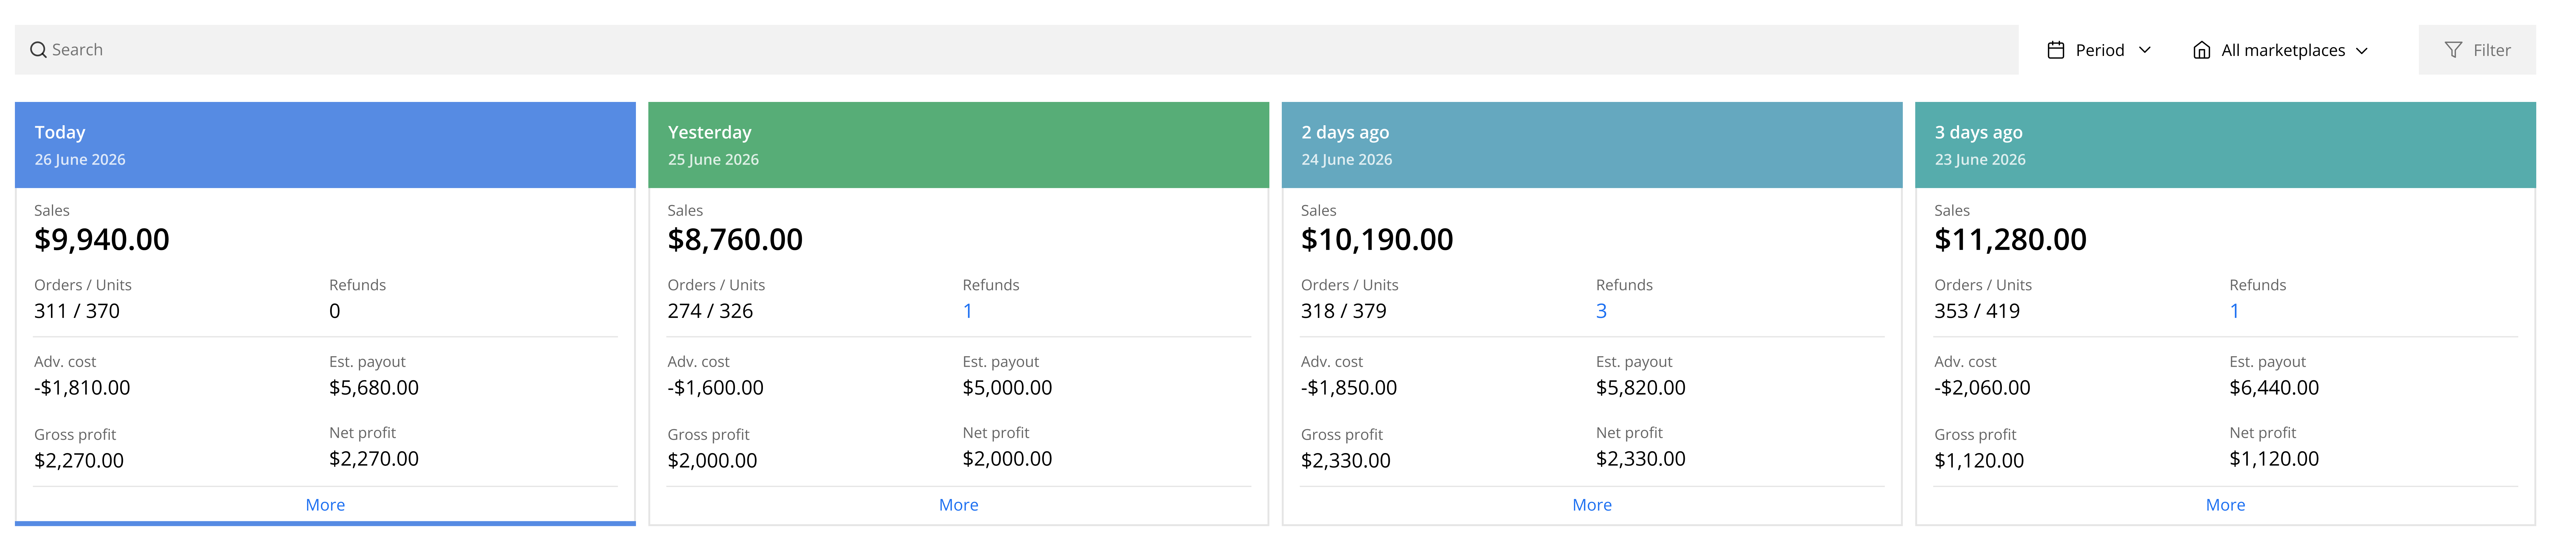
Day 1 peaked. Day 4 came in −12%.
Normal daily sales the day before Prime Day (June 22) were $2,840. Day 1 of Prime Day (June 23) hit $11,280 — nearly 4× baseline. Day 3 trough was $8,760 (still ~3× baseline), Day 4 recovered to $9,940 but never matched Day 1.
Swipe / drag left–right to read the full dashboard →
Day 1 peaked. Day 4 came in −12%.
Normal daily sales the day before Prime Day (June 22) were $6,420. Day 1 of Prime Day (June 23) hit $25,680 — a clean 4× baseline. Day 3 dropped to $20,110 (still ~3× baseline), Day 4 recovered to $22,540 but stayed 12% below Day 1.

Swipe / drag left–right to read the full dashboard →
Day 1 peaked. Day 4 came in −14%.
Normal daily sales the day before Prime Day (June 22) were $27,052. Day 1 of Prime Day (June 23) hit $59,229 — more than 2× baseline (the smaller relative multiplier reflects a higher-baseline account). Day 3 dropped to $46,873, Day 4 recovered to $50,614 but stayed 14% below Day 1.

Swipe / drag left–right to read the full dashboard →
Why did discipline beat category tailwinds?
The most operationally useful finding from our account base isn’t a category winner — it’s that the category matters less than the discipline. The 4-of-4 pattern uniformity you saw above held across categories too: beauty brands, supplement brands, and outdoor brands all produced Day 1 peaks and Day 3 troughs within a few percentage points of each other. What separated over- from under-performers within each category was operational readiness. Three things in common on the outperformers:
- Price stability for 30+ days before the event. Their 30-day floor (the strict pricing condition we wrote about in the Seller Playbook) wasn’t in the basement, so they had real room to discount.
- FBA inventory arrived early. No last-minute receiving anxiety, no inbound-queue delays during the event itself.
- The deal price was modeled net of the full fee stack — deal fee, discount, 3.5% surcharge, CPC inflation — not just the headline discount.
That third item is the quietest one. Plenty of brands ran “20% off” deals that looked good on paper and produced low single-digit margin on actuals once the full cost stack landed.
What surprised our operators this year?
The Day 1 front-loading is the surprise we’ll be studying for the rest of the year. Every piece of pre-event advice — ours included — told operators to pace budget across all four days on the assumption that the 2025 back-loaded pattern would hold. It didn’t. Sellers who bought into that framing bid conservatively on Day 1 and watched competitors capture the highest-conversion window of the event.
The second surprise: “Today’s Big Deals” three-times-daily drop cadence created sharper traffic peaks than expected. Amazon’s schedule (12 a.m., 8 a.m., 1 p.m. PDT) plus rolling refreshes every ~5 minutes during peak periods created conversion windows that didn’t match the smooth-curve Prime Day pattern of prior years. Sellers who built dayparting around those windows — adjusting bid modifiers up 30-50% in the 60 minutes following each drop — captured a disproportionate share of the event’s conversion volume.
This is the same operational edge behind Amazon PPC dayparting at any other time of year — just compressed and amplified for the event.
What should you do with these early signals?
The competitors who started cleanup on June 27 will have already negated their search-term waste, scaled their winners, and recovered their stockout ranking before any external analysis of the event lands. The signals inside your own account are more actionable than any aggregate could be — and if you’d rather have a second set of eyes on what your account actually did, the free profit-leak audit covers exactly this diagnostic across six operational surfaces.
The full 7-day sequence is in the Post-Prime Day 2026 Operator Checklist — search-term review on Day 1-2, keyword negation by Day 5, FBA fee reconciliation at Day 14, team debrief in week 2. The brands that bank Prime Day profit are the ones who run that checklist. The brands that don’t bank it forget what they learned by Q3.
What does this mean for Prime Day 2027 planning?
Three specific 2027 planning implications from what 2026 showed us:
1. Bid aggressively on Day 1 opening hours regardless of prior-year pattern. The 2026 data shows Day 1 concentrated demand more than the 2-day Prime Day formats did — brands in our sample did roughly 3× their day-before baseline on Day 1 alone. Even if 2027 reverts to a back-loaded shape, Day 1’s opening 6–12 hours are the highest-CVR window across formats. Every dollar of Day 1 budget you preserve for “later” gets redeployed onto a smaller multiplier. Bid conservatively there and you cede real revenue to whoever didn’t hedge.
2. Reserve 20–30% of your Prime Day budget for intra-event redeployment. The industry’s confident “pace across all four days” advice was wrong for 2026. Build in the flexibility to shift budget to whichever days actually convert once the event opens. Waiting until Day 3 to react to a Day 1 peak is too late — those are 48 hours you can’t buy back.
3. Watch Day 4 recovery as an intra-event signal, not a plan. In 2026, Day 4 recovered to ~87% of Day 1 — meaningful, but not exceeding Day 1. If Day 4 of Prime Day 2027 opens above Day 1’s pace, that’s the signal you’re back in a back-loaded year and can safely defer budget to the back half. If it opens below, front-loading was right and you close ranks aggressively on Day 4.
The general principle: your pre-event pacing plan has a one-year shelf life at most. Build the plan flexible enough to invert if the shape does.
Frequently asked questions
What were the Prime Day 2026 daily results?
Across the accounts we sampled, Day 1 (June 23) was the peak on every single one — sales declined through Day 3 (the low point of the event, ~21% off peak) and partially recovered on Day 4. Day 4 came in 12-15% below Day 1 across the sample. This reversed the 2025 back-loaded pattern where Day 4 outperformed Day 1.
Was Prime Day 2026 bigger than Prime Day 2025?
Early signals from our managed accounts suggest comparable or modestly higher topline volume when totaling across all four days. But the shape of the event changed dramatically — 2025 was back-loaded (Days 3-4 peaked), 2026 was front-loaded (Day 1 peaked, then declined).
How did Day 4 perform versus Day 1 in Prime Day 2026?
Day 4 came in 12-15% below Day 1 across every account we sampled. This is the opposite of 2025, when Day 4 outperformed Day 1 by a wide margin. The four-day format concentrated the peak in Day 1 rather than at the back half — sellers who paced for a back-loaded event missed the biggest single window.
Did CPCs spike during Prime Day 2026?
Yes — substantially. Across the accounts we manage, CPCs ran 60-80% above baseline on hero keywords during peak hours, with the heaviest pressure on Day 2-3 afternoons. Sellers who didn’t lift daily budget caps mid-event lost ad share to competitors who did.
How did the new 3.5% fuel surcharge affect Prime Day economics?
The surcharge — which started April 17, 2026 — adds a small but compounding cost on top of regular FBA fees. Brands that didn’t bake it into the deal-price model saw post-event per-unit margin land below forecast, especially on oversized SKUs where the fee load compounds with referral fees and the discount itself.
What should I do now that Prime Day is over?
Run the post-Prime Day cleanup within the first 7 days — the search-term report, keyword negation, scale-the-winners discipline, FBA fee reconciliation, and team debrief. The brands that bank the profit are the ones who harvest the data fast. See the 7-day operator checklist for the full sequence.
The bottom line
Prime Day 2026 inverted the pacing playbook. Day 1 was the peak on every account we watched — roughly 3× the day-before baseline — Day 3 was the mid-event low at 20–22% below Day 1, and Day 4 recovered to 87% of Day 1. Meaningful lift, but not the back-loaded finish everyone planned around. Sellers who bid conservatively on Day 1 preserving budget for a Day 4 that never came missed the biggest single conversion window of the event, and the biggest single-day sales multiplier these accounts saw in the run-up to Q3.
The strategic lesson isn’t just about Prime Day. Any pre-event playbook based on the prior year’s shape has a one-year shelf life at most. Format changes invert patterns. Sellers who adapt mid-event capture the year. Sellers who don’t spend Q3 diagnosing what they missed — exactly the recurring, format-driven leak The Profit-Leak Method is built to surface and fix permanently.
The next 7 days determine how much of 2026’s Prime Day revenue actually lands as banked profit. Run the post-event operator checklist before your competitors do — the sooner you harvest the data, the more of it converts into Q3 growth.
Want us to audit what Prime Day 2026 actually cost your account — and what to do differently in Q3? Get a free 12-page profit-leak audit, delivered in 5 business days. /audit