
$186K trough to a $415K month : scaling a pet brand 2.2× in 90 days
A pet-category brand softened to a $186K February trough, then scaled 2.2× in a single quarter — on track for a $415K May (forecast) — on a four-pillar PPC, listings, catalog, and inventory playbook.
- May forecast $415K
- vs Feb trough +122%
- Sales in 90 days 2.2×
- Sessions, Feb → May +72%
- Feb trough $186.7K
- Apr (actual) $327.7K
- May (forecast) $415.3K
- Units, Feb → May 2.4×
Performance snapshot
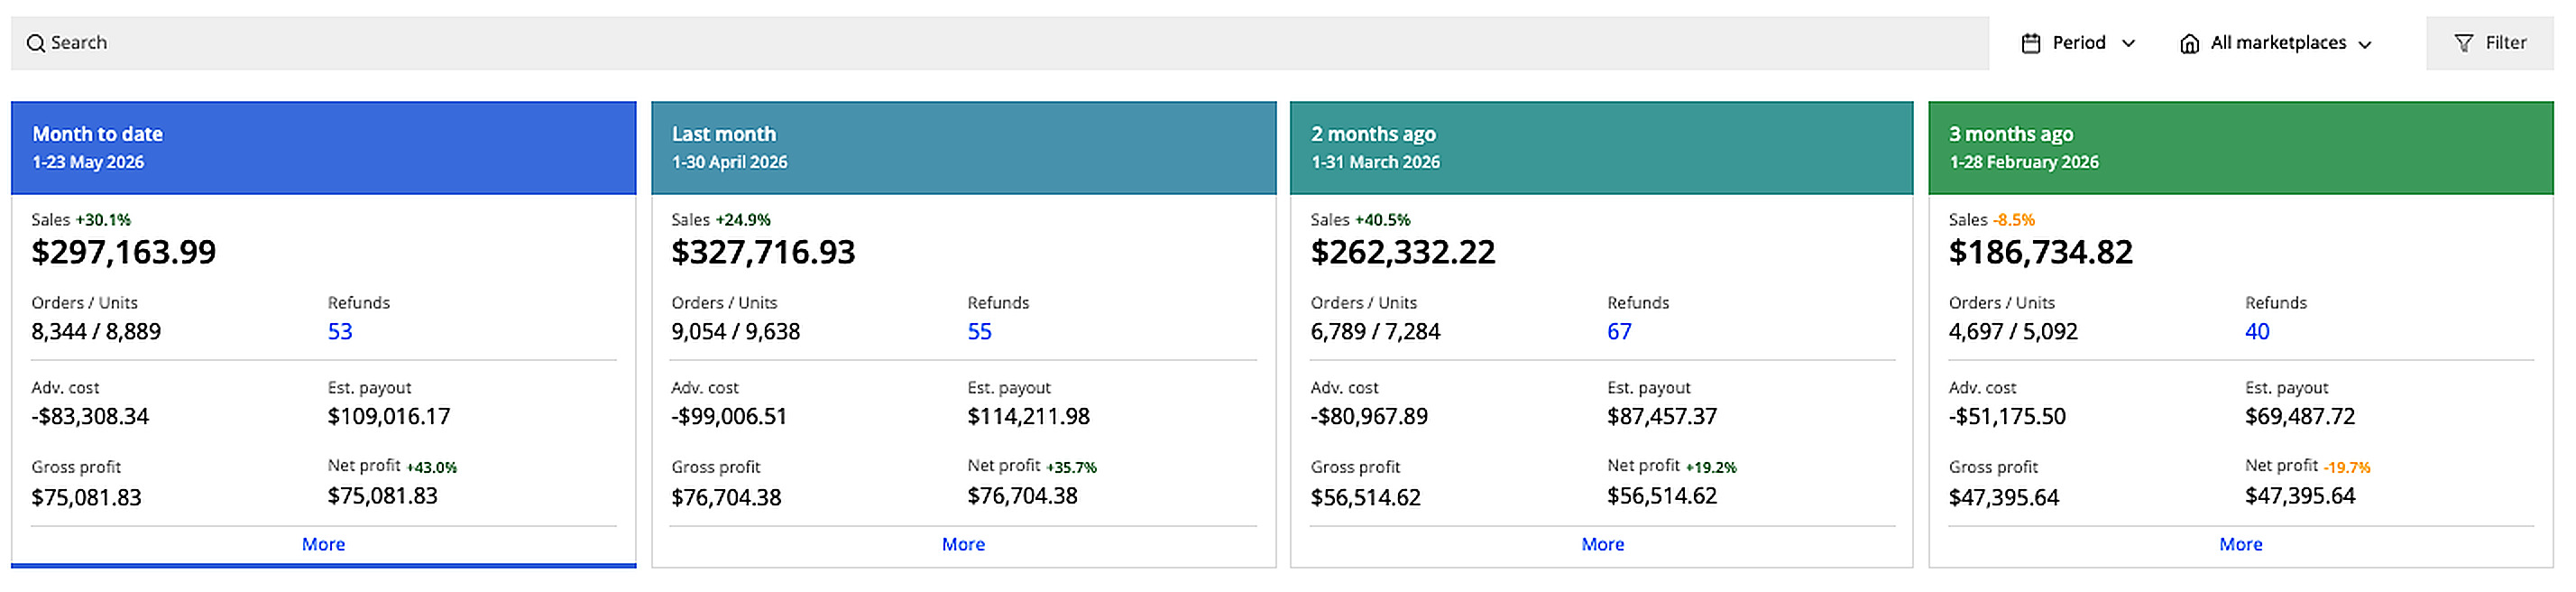
The recovery in the monthly view: February's $186.7K trough, then $262.3K in March, $327.7K in April, and May month-to-date already at $297.2K on 23 days — on pace for the $415K forecast.
- Feb trough $186.7K
- May forecast $415.3K
- Apr actual $327.7K
- Refund rate <0.7%
Brand-identifying information has been removed or anonymized before publishing.
Brand Situation
A profitable pet brand had drifted into a post-holiday trough — and couldn't see the way out.
We onboarded this pet-category brand in September 2025. It launched well and ran fat margins through Q4 while competitors hadn't reacted yet. Then the familiar shape set in: post-holiday demand softened, competitor CPCs climbed, and sales slid from $263K in October to a $186,735 trough in February — a 29% decline over four months. The brand wasn't broken. It had drifted: ad spend running without negatives, listings built for launch rather than conversion, and a catalog too narrow to capture the full category buyer.
The Challenge
Reversing a trough means rebuilding the engine before you touch the gas — without losing margin on the way up.
A soft Q1 is the worst time to spend blindly and the best time to fix structure. Three constraints made this hard:
- 01
A paid-dependent account
31 auto and broad campaigns were running with no negatives, spending into terms that never converted. Cutting spend would drop rank; leaving it would keep bleeding margin. The structure had to change before the budget could.
- 02
Conversion ceiling
Listings and the Brand Store were built to launch, not to convert. Pushing more traffic onto pages converting at category-average would have just raised the cost of every click we bought.
- 03
Scale without breaking the unit economics
Reversing the trough meant spending more — ad spend roughly 2.3×'d. Every dollar had to defend contribution margin during the climb, not just topline sales, and inventory had to hold through a 2.4× unit ramp with zero stockouts.
What We Fixed
Three moves came first — the ones that unblocked everything after.
-
Tore down the wasted PPC
Killed 31 underperforming auto and broad campaigns running with no negatives, salvaged the search-term data into a single source of truth, and rebuilt around intent: brand defense, category attack, and competitor conquest, each with its own ACOS ceiling.
-
Rebuilt the conversion surface
Mobile-first main images (pet in frame), benefit-led title rewrites indexed for 47 new keywords, A+ Premium with a competitor comparison module, and a Brand Store rebuilt by life stage and size.
-
Tightened the engine room
FBA replenishment moved from monthly to bi-weekly for zero stockouts through the ramp, a rolling coupon held the search badge, and pricing tests found headroom without a conversion drop.
Before vs After
From a $186K February trough to a $415K May forecast.
Before Optimization
- Feb 2026 trough: $186,735 in sales — down 29% from October's $263K.
- 31 auto/broad campaigns running with no negatives, spending into non-converting terms.
- Listings and Brand Store built for launch, converting at category average.
- Catalog too narrow to capture the full category buyer; refund rate 0.79%.
After Optimization
- Apr 2026 (last full month): $327,716.93 in sales — a verified actual, not a projection.
- May 2026 tracking to a $415,299 forecast: +122% vs the February trough.
- Units 5,092 → 12,425 (2.4×) and sessions 20,969 → 36,135 (+72%) over the same window.
- Ad spend up 2.3× ($51K → $118K) while ad-driven ROI improved 214.0% → 224.6%; refund rate fell to 0.60%.
Our Strategy
The 90-day sequence: reset in February, execute in March, compound in April–May.
We didn't move to the next step until the prior one was holding. Six moves, in order:
- 01
Full account audit
Before changing anything, we mapped where the spend, the conversion gaps, and the catalog holes actually were. February was for planning, not panic.
- 02
PPC teardown and intent rebuild
Killed the 31 no-negative campaigns, salvaged the search-term data, and rebuilt around brand defense, category attack, and competitor conquest with hard ACOS ceilings per role.
- 03
Listing and Brand Store rebuild
New main images, benefit-led titles indexed for 47 new keywords, A+ Premium with a comparison module, and a Brand Store rebuilt by life stage and size.
- 04
Catalog expansion
Two new SKUs (a hero size variant and an adjacent accessory) plus a bundle at a 12% discount — pre-loaded with Vine and opening-week PPC to widen the buyer and lift AOV.
- 05
Inventory and pricing discipline
Bi-weekly replenishment for zero stockouts through the ramp, a rolling coupon to hold the search badge, and $1-ladder pricing tests that found margin headroom with no conversion drop.
- 06
Weekly optimization
Negatives harvested weekly, budget reallocated to margin-positive terms, placements tuned by SKU — the system that carried the brand from the trough to the forecast.
Scaling Framework
The four-pillar playbook — run in parallel, on the same 90-day clock.
PPC scaling without conversion work just burns budget; new SKUs without inventory discipline runs you out of stock. The 2.2× came from running all four pillars together, not in sequence.
- Pillar A PPC restructure
Demand capture and defense. Intent-segmented campaigns, Sponsored Brands Video on the hero ASINs (+38% branded search in 14 days), and a weekly negative-harvest cadence.
- Pillar B Listing & brand surface
Conversion and trust. Mobile-first imagery (+11% hero CVR), keyword-indexed titles, A+ Premium, and a Brand Store rebuild (+24% store-attributed sales).
- Pillar C Catalog expansion
TAM and AOV. Two new SKUs plus a bundle (+18% AOV on bundle-takers), S&S tuning, and variation consolidation to pool reviews and ranking authority.
- Pillar D Inventory, pricing & promo
Don't break the engine. Bi-weekly replenishment (zero stockouts), badge-holding coupons, margin-aware pricing tests, and promo discipline during peak demand.
Measured Results
The 90-day scale, in verified numbers.
Sales, units, and sessions are reported actuals (Sellerboard) through April, with May shown both month-to-date and as the platform's full-month forecast.
-
Growth (Feb → May)
Monthly sales $186.7K → $415.3K (f)Units / month 5,092 → 12,425Monthly sessions 20,969 → 36,135 -
Efficiency
Ad spend $51K → $118K (2.3×)Ad-driven ROI 214.0% → 224.6%ACOS held ~27–28% -
Quality
Refund rate 0.79% → 0.60%Sellable returns 80% → 92%+S&S subscriptions ~3,300+ active
| Month | Sales | Orders | Units | Ad Spend | Sessions |
|---|---|---|---|---|---|
| Dec 2025 | $219,107 | 5,800 | 6,222 | $22,481 | 5,909 |
| Jan 2026 | $203,976 | 5,300 | 5,740 | $46,301 | 24,413 |
| Feb 2026 — trough | $186,735 | 4,697 | 5,092 | $51,176 | 20,969 |
| Mar 2026 | $262,332 | 6,789 | 7,284 | $80,968 | 32,049 |
| Apr 2026 | $327,717 | 9,054 | 9,638 | $99,007 | 43,765 |
| May 2026 (MTD) | $297,164 | 8,344 | 8,889 | $83,308 | 36,135 |
| May 2026 — forecast | $415,299 | 11,668 | 12,425 | $118,272 | ~50,000 |
The forecast in context
Sellerboard's own month-end projection for May 2026 is $415,298.85 — set against April's $327,716.93 actual and May's $297,164 month-to-date. The number is a continuation of the recovery, not a one-off spike, which is why we report it as a forecast rather than a result.
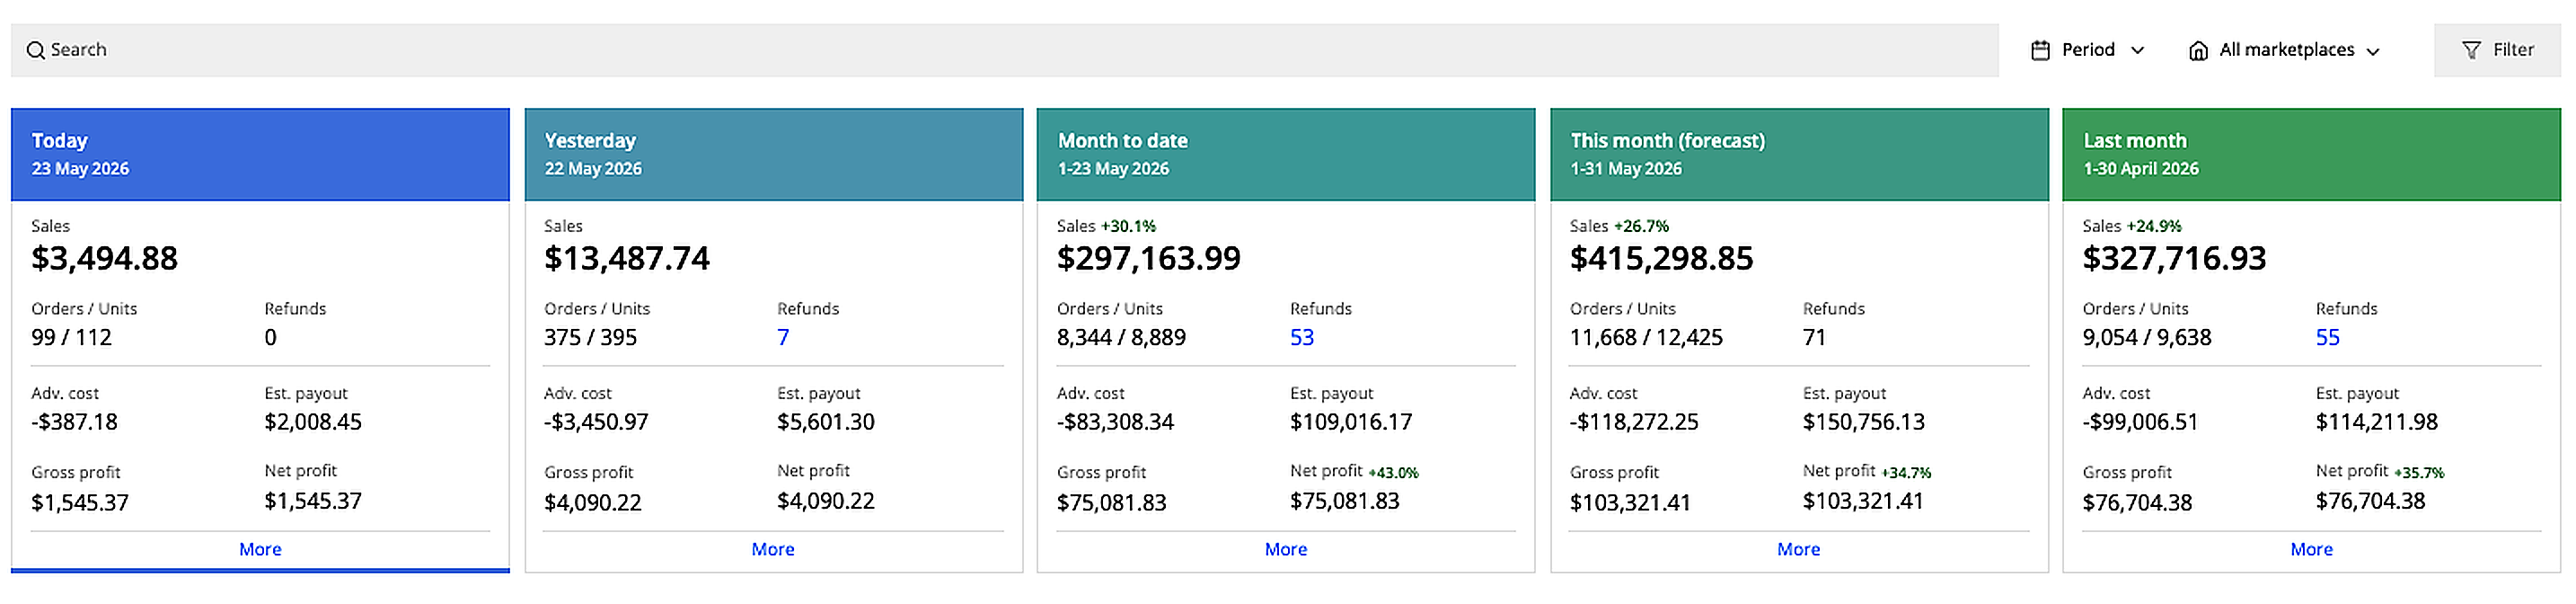
May 2026 is a platform-generated forecast; April and earlier are actuals. Brand-identifying information has been removed before publishing.
Strategic Insights
What this case study proves about reversing a trough.
Three patterns we'll carry into every engagement after this one:
-
Don't panic in Q1
Most Amazon brands soften in January and February. The trough isn't a failure signal — it's the window to rebuild infrastructure so Q2 can sprint. We used February to plan, March to execute, and April–May to compound.
-
Spend more, profitably
Ad spend ran up 2.3× ($51K → $118K) while ad-driven ROI improved from 214% to 225%. The unlock wasn't bid cuts — it was restructuring intent. Right query, right ad, right page.
-
All four pillars, or none
PPC scaling without listing-conversion work just burns budget; new SKUs without inventory discipline runs you out of stock. The 2.2× came from running all four pillars on the same 90-day clock.
What This Means for Your Brand
If your brand is sitting in a post-holiday trough, the trough is the opportunity.
A brand that looks efficient on paper but flat on growth almost always has the same problem underneath: a paid layer doing the work organic and conversion should be compounding. The fix isn't more spend on the same structure — it's rebuilding the engine first, then scaling profitable volume on top of it. That's the difference between rented growth that evaporates the moment spend pulls back and compounding growth that holds.
Key Takeaways
Ninety days, one consistent pattern.
- February was for planning, not panic — the reset happened before any budget scaled.
- Ad spend ran up 2.3× while ad-driven ROI improved — restructured intent, not bid cuts.
- All four pillars ran in parallel on the same 90-day clock, each reinforcing the others.
- Inventory held through a 2.4× unit ramp with zero stockouts; refund rate fell to 0.60%.
The 2.2× didn't come from spending harder. It came from rebuilding the engine in February so April and May could compound — which is why May is tracking to a forecast, not a fluke.
More results
Other brands we've scaled.
- $0$1.66M4 monthsLaunch 4 months
Amazon supplement brand launch
Cold launch with no reviews, no ranking, no keyword history. Four months later: $1.66M revenue at 41.6% margin.
$0 → $1.66M
4-month sales
$0 → $782K
4-month profit
67.6% → 14.4%
Ad efficiency
Read the full case study - €399€17,3668 monthsTurnaround 8 months
€399 → €17K profit turnaround
Stuck at €399/month and bleeding −€91 in losses. Eight months later: €17,366/month with +31% margin.
€399 → €17,366
Monthly revenue
−€91 → €5,637
Monthly profit
27.9% → 18.4%
ACOS
Read the full case study - €24,436€48,5206 monthsScale 6 months
Doubling a profitable brand
Profitable but plateaued at €24–34K/month with 600–700 orders. After six months: revenue doubled, profit up 51%.
€24,436 → €48,520
Monthly revenue
616 → 1,216
Monthly orders
€7,891 → €11,893
Monthly profit
Read the full case study - €6,248€10,000+6 monthsBreakthrough 6 months
Breaking the €6K plateau
Stuck at €6,000/month with 66% of sales paid. After six months: broke €10K and added +200 orders/month.
€6,248 → €10,000+
Monthly revenue
66% → <50%
PPC share
Plateau → +200/mo
Orders added
Read the full case study
Book your free Profit-Leak Audit.
30 minutes. We'll size every leak in dollars and show you which to plug first.
Book the auditYour data stays yours. See our Privacy Policy and Terms.
Figures sourced from seller analytics (Sellerboard); brand identity anonymized to protect the client. May 2026 is a platform-generated forecast — every other month is actuals.